How to Measure GPU Energy Efficiency in Cloud Workloads
Measure GPU energy efficiency in cloud workloads with PPW, PUE, utilization metrics and tools like NVIDIA-SMI, DCGM, or Zeus to reduce power use and costs.
- AI
- GPUs
- Performance

How to Measure GPU Energy Efficiency in Cloud Workloads
Optimizing GPU energy efficiency in the cloud saves money, reduces power usage, and minimizes cooling costs. Here's how to measure it accurately:
- Performance Per Watt (PPW): Calculate work done per watt using tools like
. For AI workloads, metrics like Tokens per Joule are key.nvmlDeviceGetTotalEnergyConsumption - Power Usage Effectiveness (PUE): Evaluate the total facility power versus IT equipment power. Lower PUE values mean less overhead energy.
- GPU Utilization Rates: Ensure GPUs are fully utilized to avoid idle power draw. Synchronize CPU-GPU tasks for precise readings.
Use tools like NVIDIA-SMI, DCGM, or Zeus for monitoring. Cloud providers like AWS and Google Cloud offer APIs to track GPU power and performance. To improve efficiency, set power limits, lock GPU/memory clocks, and monitor workload-specific energy metrics. For GPU selection, compare options like NVIDIA H100 (2x more efficient than A100) using platforms like ComputePrices.com. Following these steps ensures cost-effective and energy-efficient cloud workloads.
NSDI '23 - Zeus: Understanding and Optimizing GPU Energy Consumption of DNN Training
 Zeus
Zeus
::: @iframe https://www.youtube.com/embed/aZoD-jgO3fE :::
Key Metrics for Measuring Energy Efficiency
Tracking GPU energy efficiency involves focusing on three essential metrics, each offering unique insights into power consumption and performance. These metrics help evaluate everything from the computational output per watt to the overhead costs of operating cloud infrastructure.
Performance Per Watt (PPW)
Performance Per Watt (PPW) measures the amount of useful work a GPU performs for every watt of electricity it consumes. The formula is straightforward: PPW = Work Done / Energy Consumed. However, what qualifies as "work" depends on the workload. For AI training, it might mean completed training steps, while for inference tasks, particularly generative AI, Tokens per Joule has become a key metric. This measures how many text tokens the GPU generates per unit of energy [7].
To calculate PPW accurately, you can use the GPU's energy API, such as
nvmlDeviceGetTotalEnergyConsumptiontorch.cuda.synchronizejax.block_until_ready"The formula for energy efficiency is simple: work done divided by energy used." - NVIDIA Blog [7]
In May 2024, PayPal showcased the impact of optimizing PPW, improving real-time fraud detection by 10% while cutting server energy consumption by nearly eightfold through accelerated computing [7]. This example highlights how better PPW not only boosts performance but also reduces costs.
Next, let's look at facility-wide energy efficiency with PUE.
Power Usage Effectiveness (PUE)
PUE measures the ratio of total facility power to the power used by IT equipment. A PUE of 1.0 represents perfect efficiency, where all power entering the data center is used for computing. In practice, facilities also consume power for cooling, lighting, and distribution. The industry average PUE is around 1.8, but top-performing data centers achieve 1.2 or lower [8].
In 2024, Google reported a global average PUE of 1.09, meaning their data centers used 84% less overhead energy per unit of IT equipment compared to the industry average of 1.56 [10]. Meanwhile, the National Renewable Energy Laboratory's Energy Systems Integration Facility achieved an impressive PUE of 1.036 in December 2025 by utilizing an Energy Recovery Water loop to capture and reuse heat [8].
In cloud environments, higher PUE values significantly increase energy consumption beyond the GPU's direct usage. For instance, if a GPU consumes 100 kWh and the data center has a PUE of 1.5, the total energy consumed by the facility is 150 kWh [6]. When comparing cloud providers like Vast.ai, look for regions with lower PUEs, often found in cooler climates that use free-air cooling [6][10].
However, PUE has its limitations. As Christian Belady, a data center engineer, points out:
"The metric [PUE] has run its course. It improved data center efficiency when things were bad, but two decades later, they're better, and we need to focus on other metrics more relevant to today's problems." - NVIDIA Blog [7]
While PUE highlights facility overhead, it doesn't measure the useful work output of the computing equipment itself.
Now, let’s shift to GPU-specific efficiency with utilization rates.
GPU Utilization Rates
GPU utilization plays a critical role in energy efficiency because power consumption fluctuates with computational load. Even when idle or waiting for tasks from the CPU, GPUs still consume power [1]. High utilization ensures the GPU performs more work in less time, reducing the energy needed per task [7].
To maximize GPU utilization, deep learning frameworks use asynchronous execution. This means the CPU sends tasks to the GPU without waiting for them to finish, keeping the GPU busy and minimizing idle time [4]. However, this asynchronous behavior can complicate energy measurements. For example, tools like
nvidia-smiSynchronizing CPU and GPU activity (e.g., with
torch.cuda.synchronizejax.block_until_readyThe benefits of maintaining high GPU utilization are significant. In May 2024, the Perlmutter supercomputer demonstrated a 5x improvement in energy efficiency for scientific applications by leveraging accelerated computing [7]. These gains came from ensuring GPUs remained fully utilized rather than idling between tasks.
Setting Up Measurement Tools and Environment
Creating a solid monitoring setup is key to accurately measuring GPU energy efficiency for cloud-based workloads.
Selecting Cloud Providers with Monitoring APIs
Different cloud providers like Crusoe offer built-in tools to monitor GPU metrics, making it easier to track performance and energy usage. For example:
- AWS: GPU metrics are integrated into CloudWatch, offering 17 metrics per GPU, such as power draw and utilization. Each EC2 host can send up to 43,200
API calls over a 30-day period [16]. To set this up, configure IAM roles with thePutMetricData
permission and store CloudWatch agent configurations in the Systems Manager (SSM) Parameter Store for centralized management [16].cloudwatch:PutMetricData - Google Cloud: The Ops Agent, with its DCGM receiver, provides advanced telemetry. Starting with GKE version 1.32.1-gke.1357000, DCGM metrics are enabled by default [11][15]. Configuration files, located at
, let you define which metrics to collect and how often [15]./etc/google-cloud-ops-agent/config.yaml
Once the APIs are integrated, install GPU monitoring tools to maximize their capabilities.
Installing GPU Monitoring Tools
Several tools are available to monitor GPU performance and energy use, each tailored to specific needs:
- NVIDIA-SMI: A command-line tool that uses NVML to report power draw, temperature, and utilization quickly [13].
- NVIDIA Data Center GPU Manager (DCGM): Designed for cluster-level monitoring, it includes the DCGM-Exporter, which sends metrics to Prometheus and Grafana [11][12].
- Zeus: Ideal for Python-based machine learning workloads, Zeus automates API selection and CPU-GPU synchronization. It supports NVIDIA GPUs (via NVML), AMD GPUs (with ROCm 6.1+), and Apple Silicon, with minimal measurement overhead - typically under 10 milliseconds per call [4].
Here’s a quick comparison of these tools:
| Tool | Primary Use Case | Key Energy/Power Metrics |
|---|---|---|
| NVIDIA-SMI | Quick CLI checks | Power Draw (Watts), Temperature, Utilization |
| DCGM-Exporter | Kubernetes/Cluster monitoring | DCGM_FI_DEV_POWER_USAGE, DCGM_FI_DEV_TOTAL_ENERGY_CONSUMPTION |
| ZeusMonitor | Python-based ML training | Total Energy (Joules), Time per Window |
| CloudWatch Agent | AWS-native monitoring | nvidia_smi_power_draw, utilization_gpu |
| Google Ops Agent | GCP-native monitoring | SM occupancy, PCIe traffic, Power usage |
For Linux instances, enable persistence mode by running
nvidia-smi -pm 1nvidia-smi -lgc-lmcSetting Up Workload-Specific Monitoring
When monitoring workload-specific energy metrics, it’s essential to synchronize CPU and GPU operations. Use commands like
torch.cuda.synchronize()jax.block_until_ready()"To accurately measure GPU time and energy consumption, make the CPU wait for GPU work to complete." - ml.energy [1]
For NVIDIA GPUs with Volta architecture or newer, the function
nvmlDeviceGetTotalEnergyConsumptionnvmlDeviceGetPowerUsageTo avoid memory issues when using subprocesses, wrap monitoring code in
if __name__ == '__main__':sbb-itb-dd6066c
How to Measure and Improve GPU Energy Efficiency
::: @figure 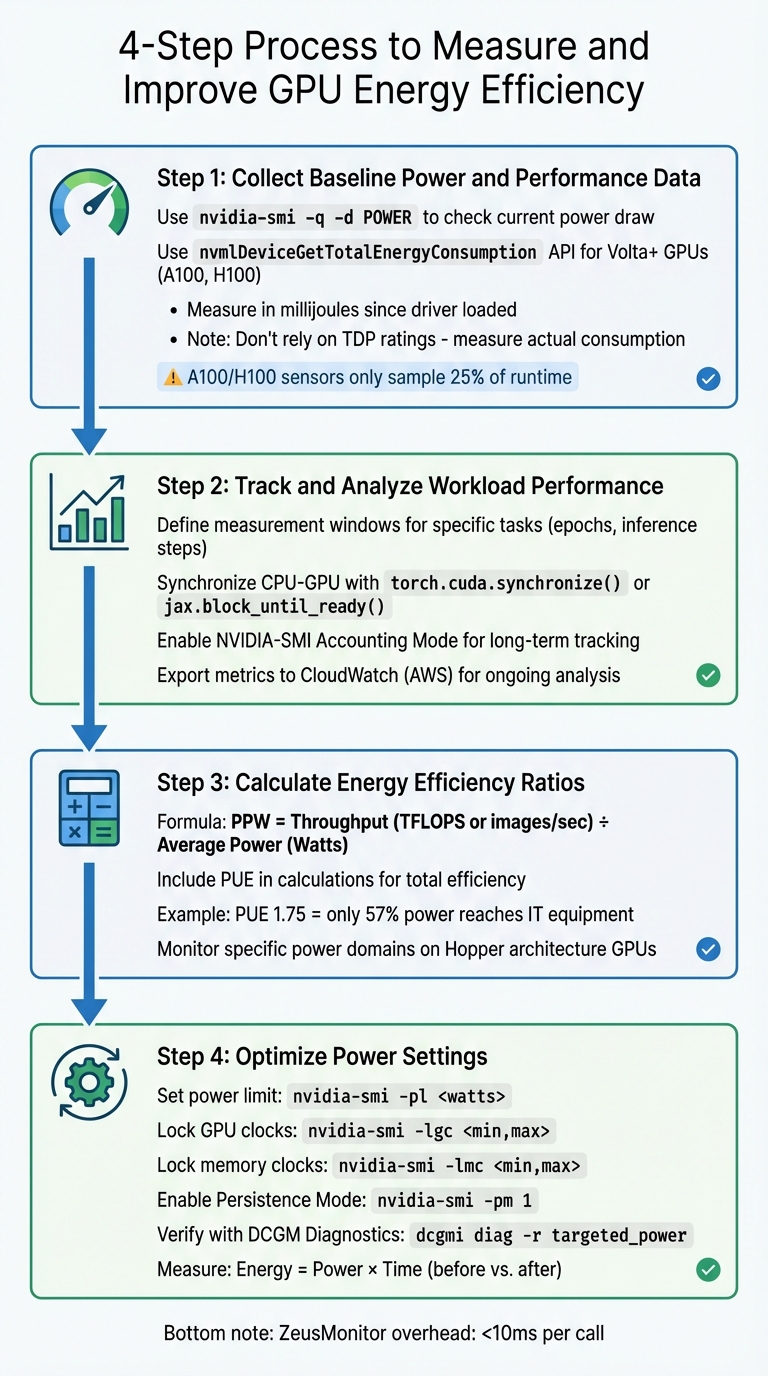 4-Step Process to Measure and Improve GPU Energy Efficiency{4-Step Process to Measure and Improve GPU Energy Efficiency}
:::
4-Step Process to Measure and Improve GPU Energy Efficiency{4-Step Process to Measure and Improve GPU Energy Efficiency}
:::
To fine-tune GPU workloads for better energy efficiency, you need a structured approach. Here’s a four-step process to help you gather and analyze the right data.
Step 1: Collect Baseline Power and Performance Data
Start by establishing baseline metrics for both power usage and performance. Use the command
nvidia-smi -q -d POWERAvoid using TDP (Thermal Design Power) as a substitute for actual power consumption. As ML.Energy advises:
"GPU Thermal Design Power (TDP) is not the best estimate. Actually measure power and energy." [1]
For NVIDIA GPUs with Volta architecture or newer (like A100 and H100), the
nvmlDeviceGetTotalEnergyConsumptionnvmlDeviceGetPowerUsageKeep in mind that sensors on NVIDIA A100 and H100 GPUs only sample about 25% of the runtime, which can lead to inaccuracies [3].
Step 2: Track and Analyze Workload Performance
To understand energy efficiency, correlate power data with workload performance. Tools like Zeus make this easier by letting you define "measurement windows" for specific tasks, such as training epochs or inference steps, using commands like
begin_windowend_windowSynchronizing the CPU and GPU is essential. Deep learning frameworks often dispatch GPU kernels asynchronously, so it’s crucial to wait for the GPU to finish before recording final measurements. Use
torch.cuda.synchronize()jax.block_until_ready()For long-term monitoring, especially in cloud environments like CoreWeave, enable NVIDIA-SMI's Accounting Mode. This feature tracks resource usage for each compute process throughout its lifecycle [17]. On AWS, you can use the CloudWatch agent to export GPU metrics - like utilization, power draw, and temperature - to CloudWatch for ongoing analysis [14].
Step 3: Calculate Energy Efficiency Ratios
To evaluate energy efficiency, calculate Performance Per Watt (PPW) by dividing your workload’s throughput (e.g., TFLOPS or images processed per second) by the average power consumption in watts. For a broader view, include Power Usage Effectiveness (PUE) in your calculations. PUE accounts for cooling and infrastructure losses, which can significantly impact overall efficiency. For example, in a 2014 U.S. data center with a PUE of 1.75, only 57% of the power reached IT equipment, while 43% was used for cooling and distribution [6].
For newer GPUs like those in the Hopper architecture, you can monitor specific power domains, such as "GPU memory average power", to pinpoint which components consume the most energy [4].
Step 4: Optimize Power Settings
Once you’ve calculated efficiency ratios, you can adjust hardware settings to improve energy performance. Start by setting a power limit with
nvidia-smi -pl <watts>For more precise control, lock GPU and memory clocks using the following commands:
for graphics clocksnvidia-smi -lgc <min,max>
for memory clocksnvidia-smi -lmc <min,max>
(On Hopper architectures, use
instead) [17].--lock-memory-clocks-deferred
Here’s a quick reference for some useful commands:
| Command | Function | Target Architecture |
|---|---|---|
| Enable Persistence Mode | All CUDA-capable |
| Set Power Limit (Watts) | Kepler and newer |
| Lock GPU Clocks | Volta and newer |
| Lock Memory Clocks | Volta and newer |
Use DCGM Diagnostics (
dcgmi diag -r targeted_power"Energy usage, defined as the product of power and time, can be optimized by carefully tuning GPU settings and application-level configurations." [19]
Finally, tools like Zeus make energy measurement quick and efficient, typically taking less than 10 milliseconds per call [4].
Benchmarking and Choosing Energy-Efficient GPUs
Running Benchmarks in Cloud Environments
Accurate energy benchmarking in cloud environments goes beyond simply looking at TDP ratings. Tools like ZeusMonitor can simplify the process by automatically detecting your GPU architecture and selecting the appropriate measurement API. For NVIDIA GPUs with Volta architecture or newer (e.g., A100 and H100), ZeusMonitor uses
nvmlDeviceGetTotalEnergyConsumptionnvmlDeviceGetPowerUsageTo ensure precise measurements, synchronize CPU and GPU execution before recording data. Since deep learning frameworks execute GPU kernels asynchronously, you’ll need to use commands like
torch.cuda.synchronize()jax.block_until_ready()For long-term tracking, export data on energy usage, power draw, and cumulative consumption to Prometheus via a Push Gateway. This setup gives you both real-time insights and historical analytics across your cloud infrastructure [4]. Keep in mind that tools like
nvidia-smiWith reliable benchmark data, you can make better-informed decisions when selecting GPUs.
Using ComputePrices.com for GPU Selection
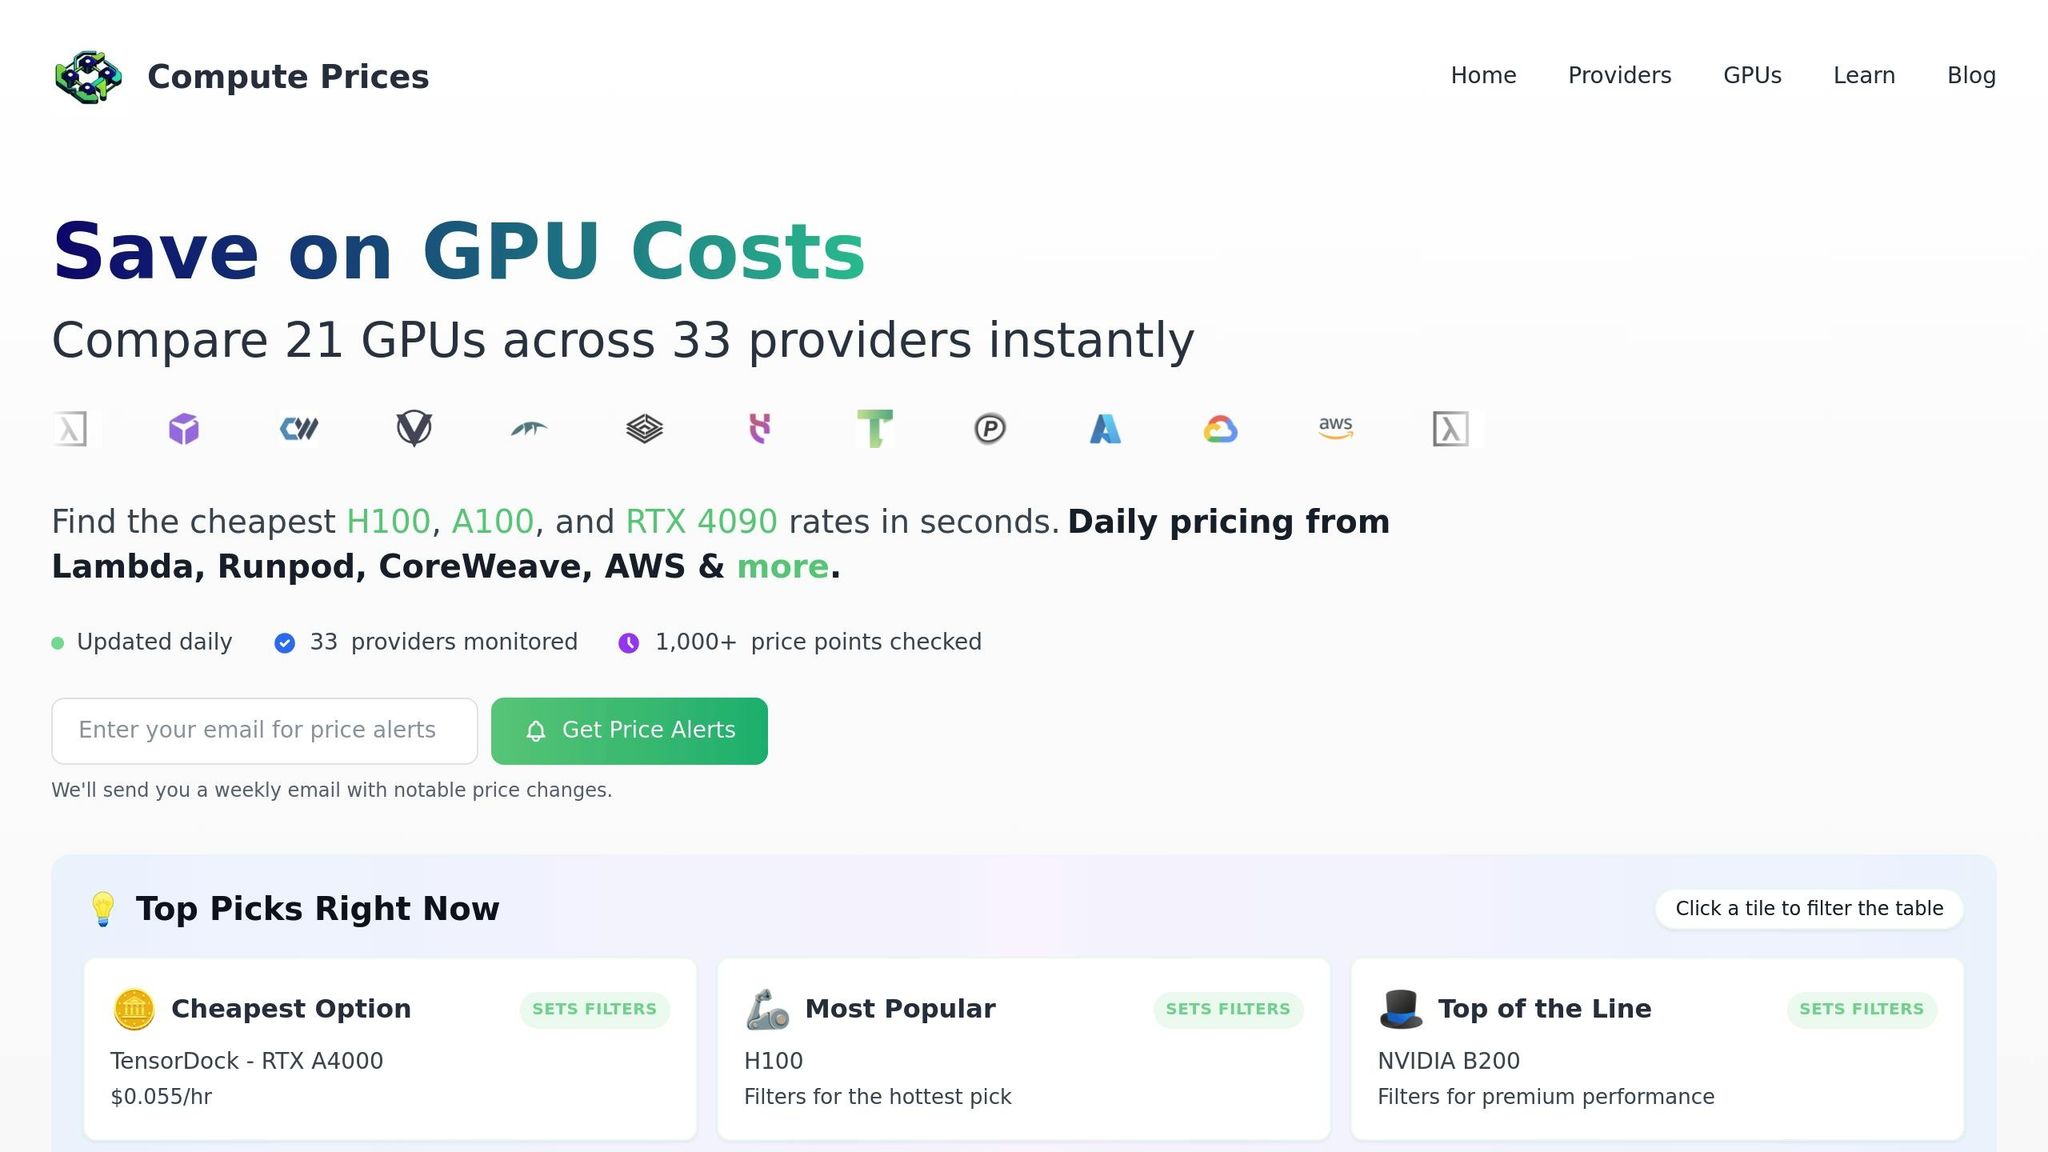 ComputePrices.com
Once you’ve gathered benchmark metrics, tools like ComputePrices.com can help you choose the most energy-efficient GPU. This platform tracks pricing and availability from 31 cloud providers, covering over 1,000 price points daily. It’s a practical way to compare cloud GPU specifications and pricing across different providers.
For large-scale language model (LLM) training, the H100 stands out, offering up to 4X faster speeds than the A100 on models like GPT-3 (175B). This speed advantage can significantly lower energy consumption by reducing runtime [20]. For instance, Lambda AI provides H100 instances on-demand for $2.99 per hour [9]. Meanwhile, for inference workloads, the H200 doubles the performance of the H100, making it a great choice for memory-intensive tasks [20].
If your workload involves smaller models or fine-tuning, the A100 (80GB) is a cost-effective alternative. Lambda AI offers this option at $1.79 per hour, and it provides enough VRAM for most mid-tier tasks [9].
ComputePrices.com allows you to filter results by use case, budget, and provider specifications. By combining insights from your benchmarks with the platform’s extensive data, you can identify the GPU that best balances energy efficiency and operational costs for your specific needs.
Conclusion
Tracking GPU energy efficiency is key to making smarter, more cost-effective decisions, especially with power limits tightening and cooling costs climbing. As NVIDIA highlights, "The only way to expand the amount of work [data centers] can do is improving power efficiency" [2]. By focusing on metrics like Performance Per Watt instead of unreliable proxies like TDP ratings, you gain critical insights to optimize both workloads and budgets.
The tools discussed in this guide offer a solid foundation for accurate energy measurement. Solutions such as ZeusMonitor can reduce measurement errors by up to 65% compared to basic readings from tools like
nvidia-smiAdding to these insights, platforms like ComputePrices.com simplify GPU selection by aggregating pricing and specifications from 31 providers. For example, the H100 delivers nearly double the energy efficiency of the A100 [2], and newer architectures continue to outperform older ones. With access to over 1,000 price points updated daily, you can quickly balance performance demands with operational costs. Whether you're handling large-scale training projects or running memory-heavy inference tasks, these tools ensure you're making informed, cost-effective choices.
FAQs
::: faq
How can I measure and improve GPU energy efficiency in cloud workloads?
To get the most out of your GPU's energy efficiency in cloud environments, start by keeping a close eye on its actual power usage during workloads. Tools like NVIDIA’s NVML or other lightweight monitoring tools can help you track energy consumption effectively. This data is invaluable for spotting underutilized periods where you can implement power-saving strategies.
You can boost efficiency by setting power caps to control peak energy usage, consolidating workloads to make the most of GPU resources, and tweaking dynamic voltage and frequency scaling (DVFS) settings to cut power consumption during lighter tasks. On top of that, refining your software stack - such as using mixed-precision calculations and removing unnecessary operations - can make a noticeable difference. Keep monitoring and fine-tuning these settings regularly to ensure you’re maintaining the best possible energy efficiency over time.
By combining real-time monitoring, smarter workload management, and software optimization, you can not only improve GPU energy efficiency but also cut down on costs in cloud environments. :::
::: faq
What are the best tools to monitor GPU power usage in cloud workloads?
To keep an eye on GPU power usage in cloud-based workloads, there are several tools that can provide detailed and useful insights:
-
: NVIDIA's command-line tool offers real-time data on GPU power consumption (measured in watts), along with other key metrics like utilization and temperature. It also allows you to export this data for further analysis.nvidia-smi -
Zeus library: If you're working with Python, this library is a great option. It tracks power usage, energy consumption, and execution time with minimal overhead, making it especially handy for tasks like training machine learning models or running inference.
-
Cloud monitoring solutions: Services like Amazon CloudWatch and Google Cloud Monitoring can integrate with GPU metrics. They gather power consumption data through agents or scripts and present it on dashboards, making it easier to analyze and manage.
Using these tools, you can effectively monitor GPU power consumption, improve energy efficiency, and make smarter decisions to balance costs and performance. :::
::: faq
Why is Performance Per Watt (PPW) crucial for GPU workloads?
Performance per watt (PPW) measures how effectively a GPU transforms electrical power into computational output. This metric plays a crucial role in determining performance, controlling operating costs, and minimizing heat production - factors that are essential for optimizing cloud workloads and managing energy use in data centers.
Prioritizing PPW can help lower electricity bills, ensure efficient power usage, and deliver stronger performance in power-limited settings. This becomes particularly critical for energy-intensive tasks like AI training and inference, where efficiency directly influences scalability and long-term expenses. :::