How to Monitor GPU Utilization in Cloud Environments
Monitor GPU utilization in cloud environments with key metrics, setup steps, cloud-native and third-party tools, and practical cost-saving tips.
- AI
- GPUs
- Performance

How to Monitor GPU Utilization in Cloud Environments
Monitoring GPU usage in cloud setups is essential for improving performance and cutting costs. GPUs play a critical role in AI and machine learning workloads, but tracking their performance requires specialized tools and metrics beyond standard CPU and memory monitoring. Here's the quick takeaway:
- Key Metrics: GPU utilization, memory usage, temperature (°F), and power consumption (watts).
- Tools: Cloud-native options like AWS CloudWatch, Google Cloud Ops Agent, and OCI Monitoring provide tailored solutions. Third-party tools like Datadog and Splunk offer deeper insights.
- Setup: Ensure proper NVIDIA drivers, agents (e.g., Unified CloudWatch Agent), and permissions are configured.
- Cost Efficiency: Monitor underutilized GPUs to avoid waste. Use services like ComputePrices.com to find affordable GPU options.
Tracking these metrics helps identify inefficiencies, optimize workloads, and manage expenses effectively. Below, we dive into the tools, configurations, and strategies to monitor GPU performance in cloud environments.
Prerequisites for GPU Monitoring
Hardware and Software Requirements
To get started with GPU monitoring, you'll need to provision cloud instances equipped with NVIDIA GPUs. Popular options include AWS P2, P3, G4 instances and Google Cloud GPU VMs. If you’re planning to use advanced telemetry with NVIDIA's DCGM, make sure to select specialized NVIDIA Datacenter GPUs [7].
Next, install the latest NVIDIA GPU drivers. To simplify this step, you can use pre-configured images like AWS Deep Learning AMIs or Google Cloud's Deep Learning VM images, which typically come with managed drivers and monitoring tools already set up [3][6].
For monitoring, install cloud-specific agents:
- AWS: Use the Unified CloudWatch Agent or a Python-based script like
.gpumon.py - Google Cloud: Deploy the Ops Agent (version 2.38.0 or higher for Linux) or PowerShell scripts for Windows.
- Kubernetes: Leverage the DCGM-Exporter for GPU metrics.
AWS CloudWatch, for example, tracks 17 GPU metrics such as utilization, temperature, power draw, and fan speed [3][7][8][10]. Once the drivers and agents are in place, make sure to configure access permissions to ensure seamless metric reporting.
Access and Configuration Basics
With the hardware and software ready, the next step is to configure access for efficient metric collection.
For AWS, set up IAM roles with the
cloudwatch:PutMetricDataroles/monitoring.metricWriterroles/compute.instanceAdmin.v1sudoKeep in mind, AWS CloudWatch offers a free tier that includes 10 metrics, 10 alarms, and 1 million API requests per month [1]. However, custom GPU metrics can incur additional charges since each host performs a
PutMetricDataMonitoring the GPU utilization of your interactive training jobs using NVDashboard
::: @iframe https://www.youtube.com/embed/jAxij3k_f3M :::
Cloud-Native GPU Monitoring Tools
::: @figure 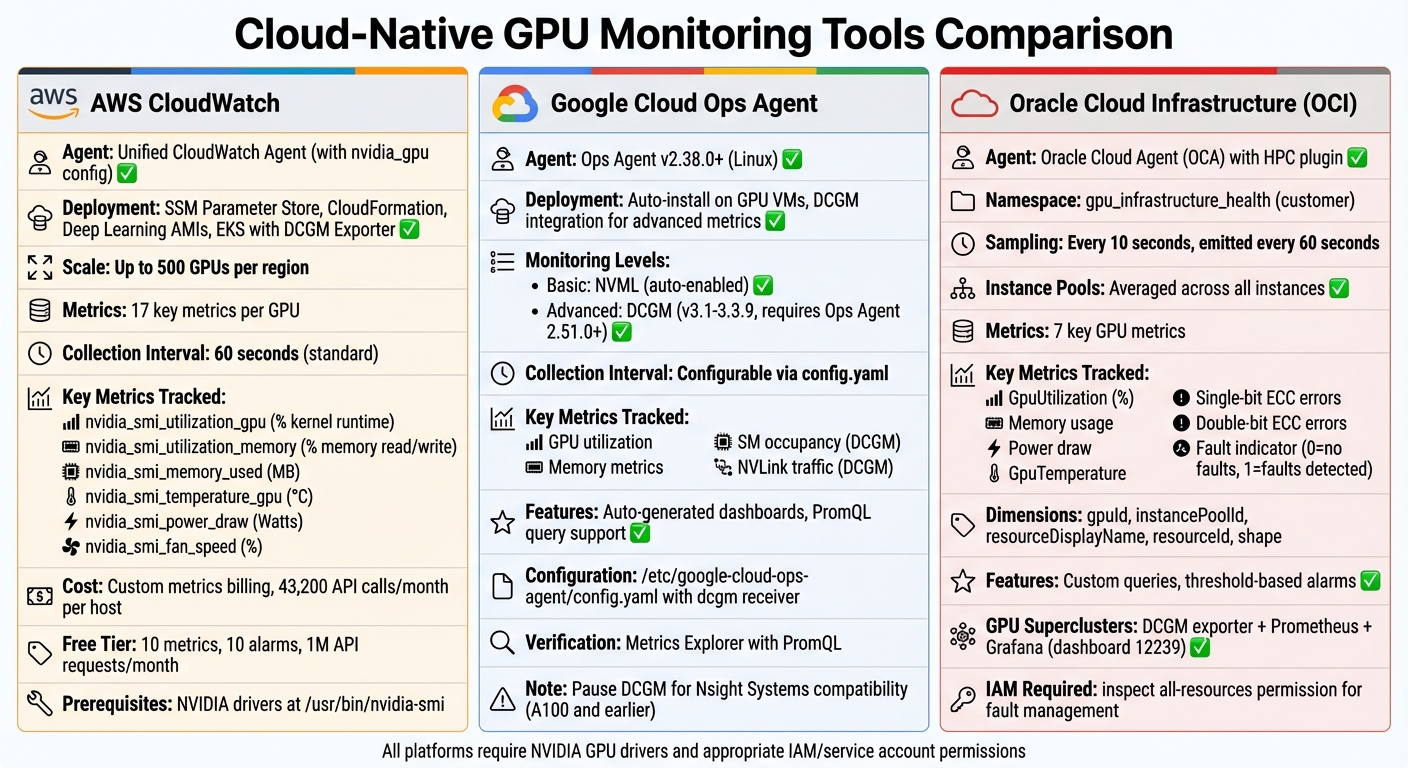 Cloud GPU Monitoring Tools Comparison: AWS CloudWatch vs Google Cloud Ops Agent vs Oracle OCI{Cloud GPU Monitoring Tools Comparison: AWS CloudWatch vs Google Cloud Ops Agent vs Oracle OCI}
:::
Cloud GPU Monitoring Tools Comparison: AWS CloudWatch vs Google Cloud Ops Agent vs Oracle OCI{Cloud GPU Monitoring Tools Comparison: AWS CloudWatch vs Google Cloud Ops Agent vs Oracle OCI}
:::
Building on the earlier discussion about hardware and access configurations, cloud-native tools simplify GPU monitoring in cloud environments, offering tailored solutions for different platforms.
AWS CloudWatch for NVIDIA GPUs
 AWS CloudWatch
With AWS CloudWatch, GPU monitoring is now integrated into the unified CloudWatch agent, removing the need for custom scripts.
To enable this feature, include an
nvidia_gpumetrics_collectedBefore proceeding, ensure NVIDIA drivers are installed and verified using
nvidia-smi/usr/bin/nvidia-sminvidia_gpuAWS CloudWatch supports monitoring up to 500 GPUs per region, providing 17 key metrics per GPU [10]. These metrics are categorized by GPU
indexnamearch| Metric Name | Description |
|---|---|
| Percentage of time one or more kernels were running on the GPU [11] |
| Percentage of time global memory was being read or written [11] |
| Amount of GPU memory currently in use (in MB) [11] |
| Core GPU temperature in degrees Celsius [11] |
| Last measured power draw for the entire board in Watts [11] |
| Percentage of maximum fan speed the device is currently running at [11] |
Next, let’s examine Google Cloud’s GPU monitoring tools.
Google Cloud Ops Agent
 Google Cloud Ops Agent
Google Cloud provides two levels of GPU monitoring via the Ops Agent, which is compatible with Linux systems [14][3]. The basic tier uses NVML to automatically collect GPU utilization and memory metrics upon installation [15][3]. For more advanced metrics, such as SM occupancy and NVLink traffic, you can enable DCGM integration [14][15]. These metrics align with the foundational parameters discussed earlier.
To begin, install Ops Agent version 2.38.0 or higher on a Linux VM equipped with NVIDIA GPUs and drivers [3][14]. For DCGM metrics, you’ll need Ops Agent 2.51.0+ and DCGM versions 3.1–3.3.9 [14]. Once DCGM integration is enabled, update the
/etc/google-cloud-ops-agent/config.yamldcgmreceiver_version2sudo systemctl restart google-cloud-ops-agentOnce active, dashboards are automatically added to Cloud Monitoring, and you can verify data ingestion using the Metrics Explorer with a PromQL query like
{workload.googleapis.com/gpu.dcgm.sm.utilization", monitored_resource="gce_instance"}dcgmi profile --pauseNext, let’s explore Oracle Cloud Infrastructure’s capabilities for GPU monitoring.
Oracle Cloud Infrastructure (OCI) Monitoring
OCI offers specialized GPU monitoring features, but they are available only on instances with the Oracle Cloud Agent (OCA) HPC plugin enabled [16]. Metrics are stored in the
gpu_infrastructure_healthTo access these metrics, enable the HPC plugin with GPU and RDMA monitoring on your compute instance via the Oracle Cloud Agent [16]. You can then create custom queries and set up alarms based on thresholds, such as
GpuTemperatureGpuUtilizationgpuIdinstancePoolIdresourceDisplayNameresourceIdshapeOCI tracks seven key GPU metrics, including utilization percentages, memory usage, power draw, temperature, single-bit and double-bit ECC errors, and a binary fault indicator (0 for no faults, 1 for detected faults) [16]. For monitoring GPU Superclusters, deploy the NVIDIA DCGM exporter with Prometheus and Grafana (dashboard 12239) [17]. Proper monitoring not only improves performance visibility but also aids in managing costs. Ensure your IAM policies allow a dynamic group of instances to "inspect all-resources" in the tenancy or specific compartment for fault management [16].
sbb-itb-dd6066c
Third-Party and Open-Source Monitoring Tools
Third-party and open-source tools can provide a deeper understanding of GPU metrics by linking hardware data with application-level performance indicators, such as model latency and inference errors [20]. They also deliver advanced profiling metrics like SM occupancy and Tensor Core activity - details that cloud-native tools might overlook [19][9]. These tools complement cloud-native monitoring by offering broader platform coverage and more customization options. Below, we’ll explore how to configure Splunk/AppDynamics and Datadog to enhance your monitoring setup.
Monitoring with Splunk and AppDynamics
 Splunk
To enable agent-based GPU monitoring with Splunk or AppDynamics, ensure your NVIDIA driver is version 550.x or higher. You can verify this using the
nvidia-smiThere are three ways to enable GPU support in AppDynamics:
- Modify the
file.controller-info.xml - Set the Java system property:
.-Dappdynamics.machine.agent.gpu.collection.nvml.enabled=true - Use the environment variable:
for containerized environments [18].APPDYNAMICS_MACHINE_AGENT_GPU_ENABLED=true
Additionally, GPU monitoring must be activated at the Controller account level by enabling the
sim.cluster.gpu.enabledFor better integration, use the NVIDIA DCGM Exporter to convert GPU telemetry into Prometheus-style metrics for Splunk or AppDynamics [9]. The exporter provides access to more than 100 field IDs, including metrics like
DCGM_FI_PROF_SM_ACTIVEDCGM_FI_DEV_FB_USEDsudo service nvidia-dcgm statusdcgmi profile --pauseOther third-party tools, such as Datadog, also provide unified monitoring solutions for hybrid environments.
Datadog GPU Monitoring
Datadog offers a unified monitoring platform that works seamlessly across cloud providers and on-premises setups, making it a strong choice for hybrid infrastructures [20]. A 14-day free trial is available for its infrastructure monitoring tools, which include GPU integrations [20].
To get started, install the Datadog agent on GPU-enabled instances and activate NVIDIA integration. The agent automatically detects GPUs and begins tracking key metrics for various models, including Tesla, A100, Kepler, and Maxwell series GPUs [20]. Key performance indicators include:
- Utilization:
tracks GPU usage percentage.DCGM_FI_DEV_GPU_UTIL - Memory:
monitors memory consumption.DCGM_FI_DEV_FB_USED - Tensor Core Activity:
measures Tensor Core usage during AI workloads [20].DCGM_FI_PROF_PIPE_TENSOR_ACTIVE
For hardware health, Datadog tracks temperature (
DCGM_FI_DEV_GPU_TEMPSet up dashboards to monitor trends and configure alerts for key thresholds. For instance, you can create alerts for low GPU utilization to identify and reallocate underused resources. Comparing compute utilization with I/O metrics, such as PCIe or NVLink traffic, can help pinpoint data transfer bottlenecks [20]. This correlation between infrastructure and application performance not only improves hardware efficiency but also reduces model serving latency, aligning with earlier discussions on optimizing costs and performance.
Analyzing Metrics and Improving GPU Usage
Key Metrics and What They Mean
Understanding GPU metrics is essential for fine-tuning performance and managing cloud GPU expenses effectively. While GPU utilization might seem like the go-to metric, it can be misleading. For instance, even at 100% utilization, your GPU may be stalling if power consumption remains low. This often points to inefficient data movement. Mohan Atreya from Rafay explains it well:
"Utilization by itself can be a misleading metric. You can easily hit 100% where the GPU is doing a lot of waiting. Power consumption is a better (but not perfect) measure" [22].
Power draw is often a better indicator of actual workload. High-end GPUs like the H100 or A100 should operate near their full power capacity during peak performance [23]. On the other hand, high memory usage combined with low compute activity suggests a memory-bound workload. Similarly, maxed-out PCIe or NVLink traffic paired with low compute indicates bottlenecks in data transfer [22][5].
Temperature is another critical metric to monitor. High-performance GPUs, such as the H100, may throttle performance when temperatures approach 167°F (75°C) due to thermal noise and error correction [23]. Regularly checking SM clock speeds can help identify throttling issues - if the clock speed drops below the base frequency, it may signal thermal or power limitations [22][5].
Here’s a quick breakdown of key metrics and their implications:
| Metric | What It Indicates | Action to Take |
|---|---|---|
| GPU Utilization | Percentage of time kernels are active | If consistently low, consolidate workloads or right-size instances [21][22] |
| Power Draw | Proxy for actual work being performed | If low while utilization is high, investigate for stalls or waiting [22][23] |
| Memory Utilization | Percentage of VRAM in use | If high, increase GPU memory or optimize batch size to avoid OOM errors [22][5] |
| SM Clock Speed | Current processor frequency | If lower than base, check for thermal or power throttling [22][5] |
| PCIe/NVLink Throughput | Data transfer rate between components | If at max bandwidth, optimize data transfer patterns [5] |
| Temperature | Thermal health of the GPU die | If high, inspect cooling systems or reduce load to prevent damage [22][23] |
By keeping an eye on these metrics, you can strike a balance between performance optimization and cost efficiency.
Reducing Costs with ComputePrices.com
 ComputePrices.com
Once you've analyzed your GPU metrics, you can take actionable steps to cut costs. ComputePrices.com is a valuable tool for this, tracking daily prices from 31 providers across more than 1,000 GPU configurations. Whether you're using an H100, A100, or RTX 4090, this platform helps you find competitive pricing tailored to your needs.
If your metrics show underutilization, ComputePrices.com can guide you toward more affordable GPUs that align better with your workload. Its daily updates ensure you stay on top of pricing trends, making it easier to allocate budgets accurately. Plus, with filtering options based on use case and budget, you can quickly identify cost-effective alternatives, avoiding unnecessary expenses on overpowered hardware.
Conclusion
Keeping an eye on GPU utilization in cloud environments is essential for managing costs and ensuring your systems perform at their best. Without proper monitoring, you could end up wasting resources or missing critical performance issues that could hinder your AI and machine learning workloads.
The tools we’ve discussed give you the transparency needed to fine-tune your infrastructure. As experts from AWS note, monitoring plays a key role in tracking and maintaining efficient resource use, especially in resource-intensive machine learning applications [2]. These tools don’t just show you GPU usage - they help you understand the broader performance metrics that matter.
However, GPU utilization is just one piece of the puzzle. Metrics like power consumption, memory usage, and temperature are equally important for getting the full picture of performance. If you notice GPUs running below capacity, it’s a clear sign to consolidate workloads or consider switching to more cost-effective hardware. Setting up automated alerts can help you catch inefficiencies early, saving both time and money.
Additionally, platforms like ComputePrices.com provide daily-updated pricing to help you choose GPUs that fit your workload requirements. Whether you’re working with H100s for large-scale training or RTX 4090s for development, aligning your hardware selection with your actual usage patterns ensures you get the best performance for your budget.
Start by deploying a monitoring agent to track key metrics and set up alerts. As you dig into the data, you’ll uncover opportunities to adjust batch sizes, enable mixed precision training, or use spot instances for non-critical tasks. These small changes can lead to big savings and better performance. By combining effective monitoring with smart cost management strategies, you can keep your AI and machine learning projects running smoothly while staying within budget.
FAQs
::: faq
What metrics should I monitor to track GPU performance in cloud environments?
To keep track of GPU performance in cloud-based AI and machine learning tasks, it's important to zero in on key metrics that reveal both efficiency and hardware condition. These include:
- GPU utilization: The percentage of compute cores actively in use.
- Memory usage: How much VRAM is being used compared to the total available.
- Power consumption: Measured in watts, this indicates energy usage.
- Temperature: Monitored in °F or °C, ensuring hardware operates within safe limits.
- Fan speed: A measure of cooling performance.
These metrics are essential for confirming that your GPUs are operating efficiently and safely.
To gather this data, tools like NVIDIA’s System Management Interface (nvidia-smi) or monitoring agents provided by cloud platforms are incredibly useful. For deeper insights, such as streaming multiprocessor (SM) utilization or memory bandwidth, you can turn to solutions like NVIDIA DCGM or cloud-specific telemetry tools. Keeping an eye on these advanced metrics allows you to fine-tune performance, avoid wasting resources, and maintain the reliability of your hardware.
If you're looking to balance performance monitoring with cost-effective resource provisioning, platforms like ComputePrices.com can be a big help. They provide up-to-date pricing and detailed specifications for GPUs across major cloud providers, making it easier to pick the right instance for your specific workload. :::
::: faq
How can I optimize GPU costs in cloud environments?
To keep GPU costs in check when using cloud services, start by keeping an eye on key performance indicators like utilization, memory usage, and temperature. These metrics can help you pinpoint underutilized GPUs, allowing you to consolidate workloads or shut down idle instances to avoid unnecessary spending. Most cloud providers offer built-in tools for performance tracking. For instance, Google’s Ops Agent and AWS’s CloudWatch can monitor GPU usage and even send alerts when utilization drops. If you're working in Kubernetes environments, the NVIDIA DCGM Exporter, paired with Prometheus/Grafana, provides detailed GPU data, enabling smarter scaling decisions.
Once you have solid performance data, consider the following cost-saving strategies:
- Autoscaling: Dynamically adjust GPU resources based on current demand.
- Off-hours shutdowns: Power down GPUs used for non-critical workloads during low-usage periods.
- Spot or preemptible instances: Opt for these more affordable options if your tasks can handle occasional interruptions.
- Rate comparisons: Regularly check pricing across providers to ensure you're getting the best deal for the GPU model you need.
Tools like ComputePrices.com simplify this process by aggregating pricing data from 31 providers and tracking over 1,000 daily price points. Whether you're using GPUs like the H100, A100, or RTX 4090, this platform can help you identify cost-effective options. By combining constant monitoring, flexible scaling, and smart provider choices, you can align your GPU spending with your actual workload demands. :::
::: faq
What are the best ways to monitor GPU usage on AWS and Google Cloud?
To keep tabs on GPU usage in AWS, you can rely on Amazon CloudWatch paired with the CloudWatch Agent. This combo lets you track metrics such as GPU utilization, memory usage, power consumption, and temperature. For a quick and straightforward setup, the gpumon.py script, pre-installed on Deep Learning AMIs, can send GPU stats directly to CloudWatch. If you need more in-depth monitoring, tools like nvidia-smi and NVIDIA DCGM can gather additional metrics and feed them into CloudWatch for detailed visualization.
On Google Cloud, the Ops Agent is the primary tool for monitoring GPU metrics on Compute Engine VMs. It streams data such as GPU usage and memory stats to Cloud Monitoring, where you can create dashboards and set up alerts. For Windows-based VMs, a lightweight GPU metrics script can be deployed to ensure consistent monitoring. These tools provide real-time insights into GPU performance, helping you fine-tune your workloads for better efficiency. :::